USA is a USD 21 Trillion economy. The country is home to 327 million residents and ~4.5 million Indian NRIs and PIOs. USA’s GDP has shown a significant growth from USD 18.7 Trillion in 2016 to USD 21.4 Trillion in 2019. On an average, the household consumption expenditure accounts for approximately 67% of the GDP and final consumption accounts for around 81% of the GDP, indicating a potential consumer goods market.
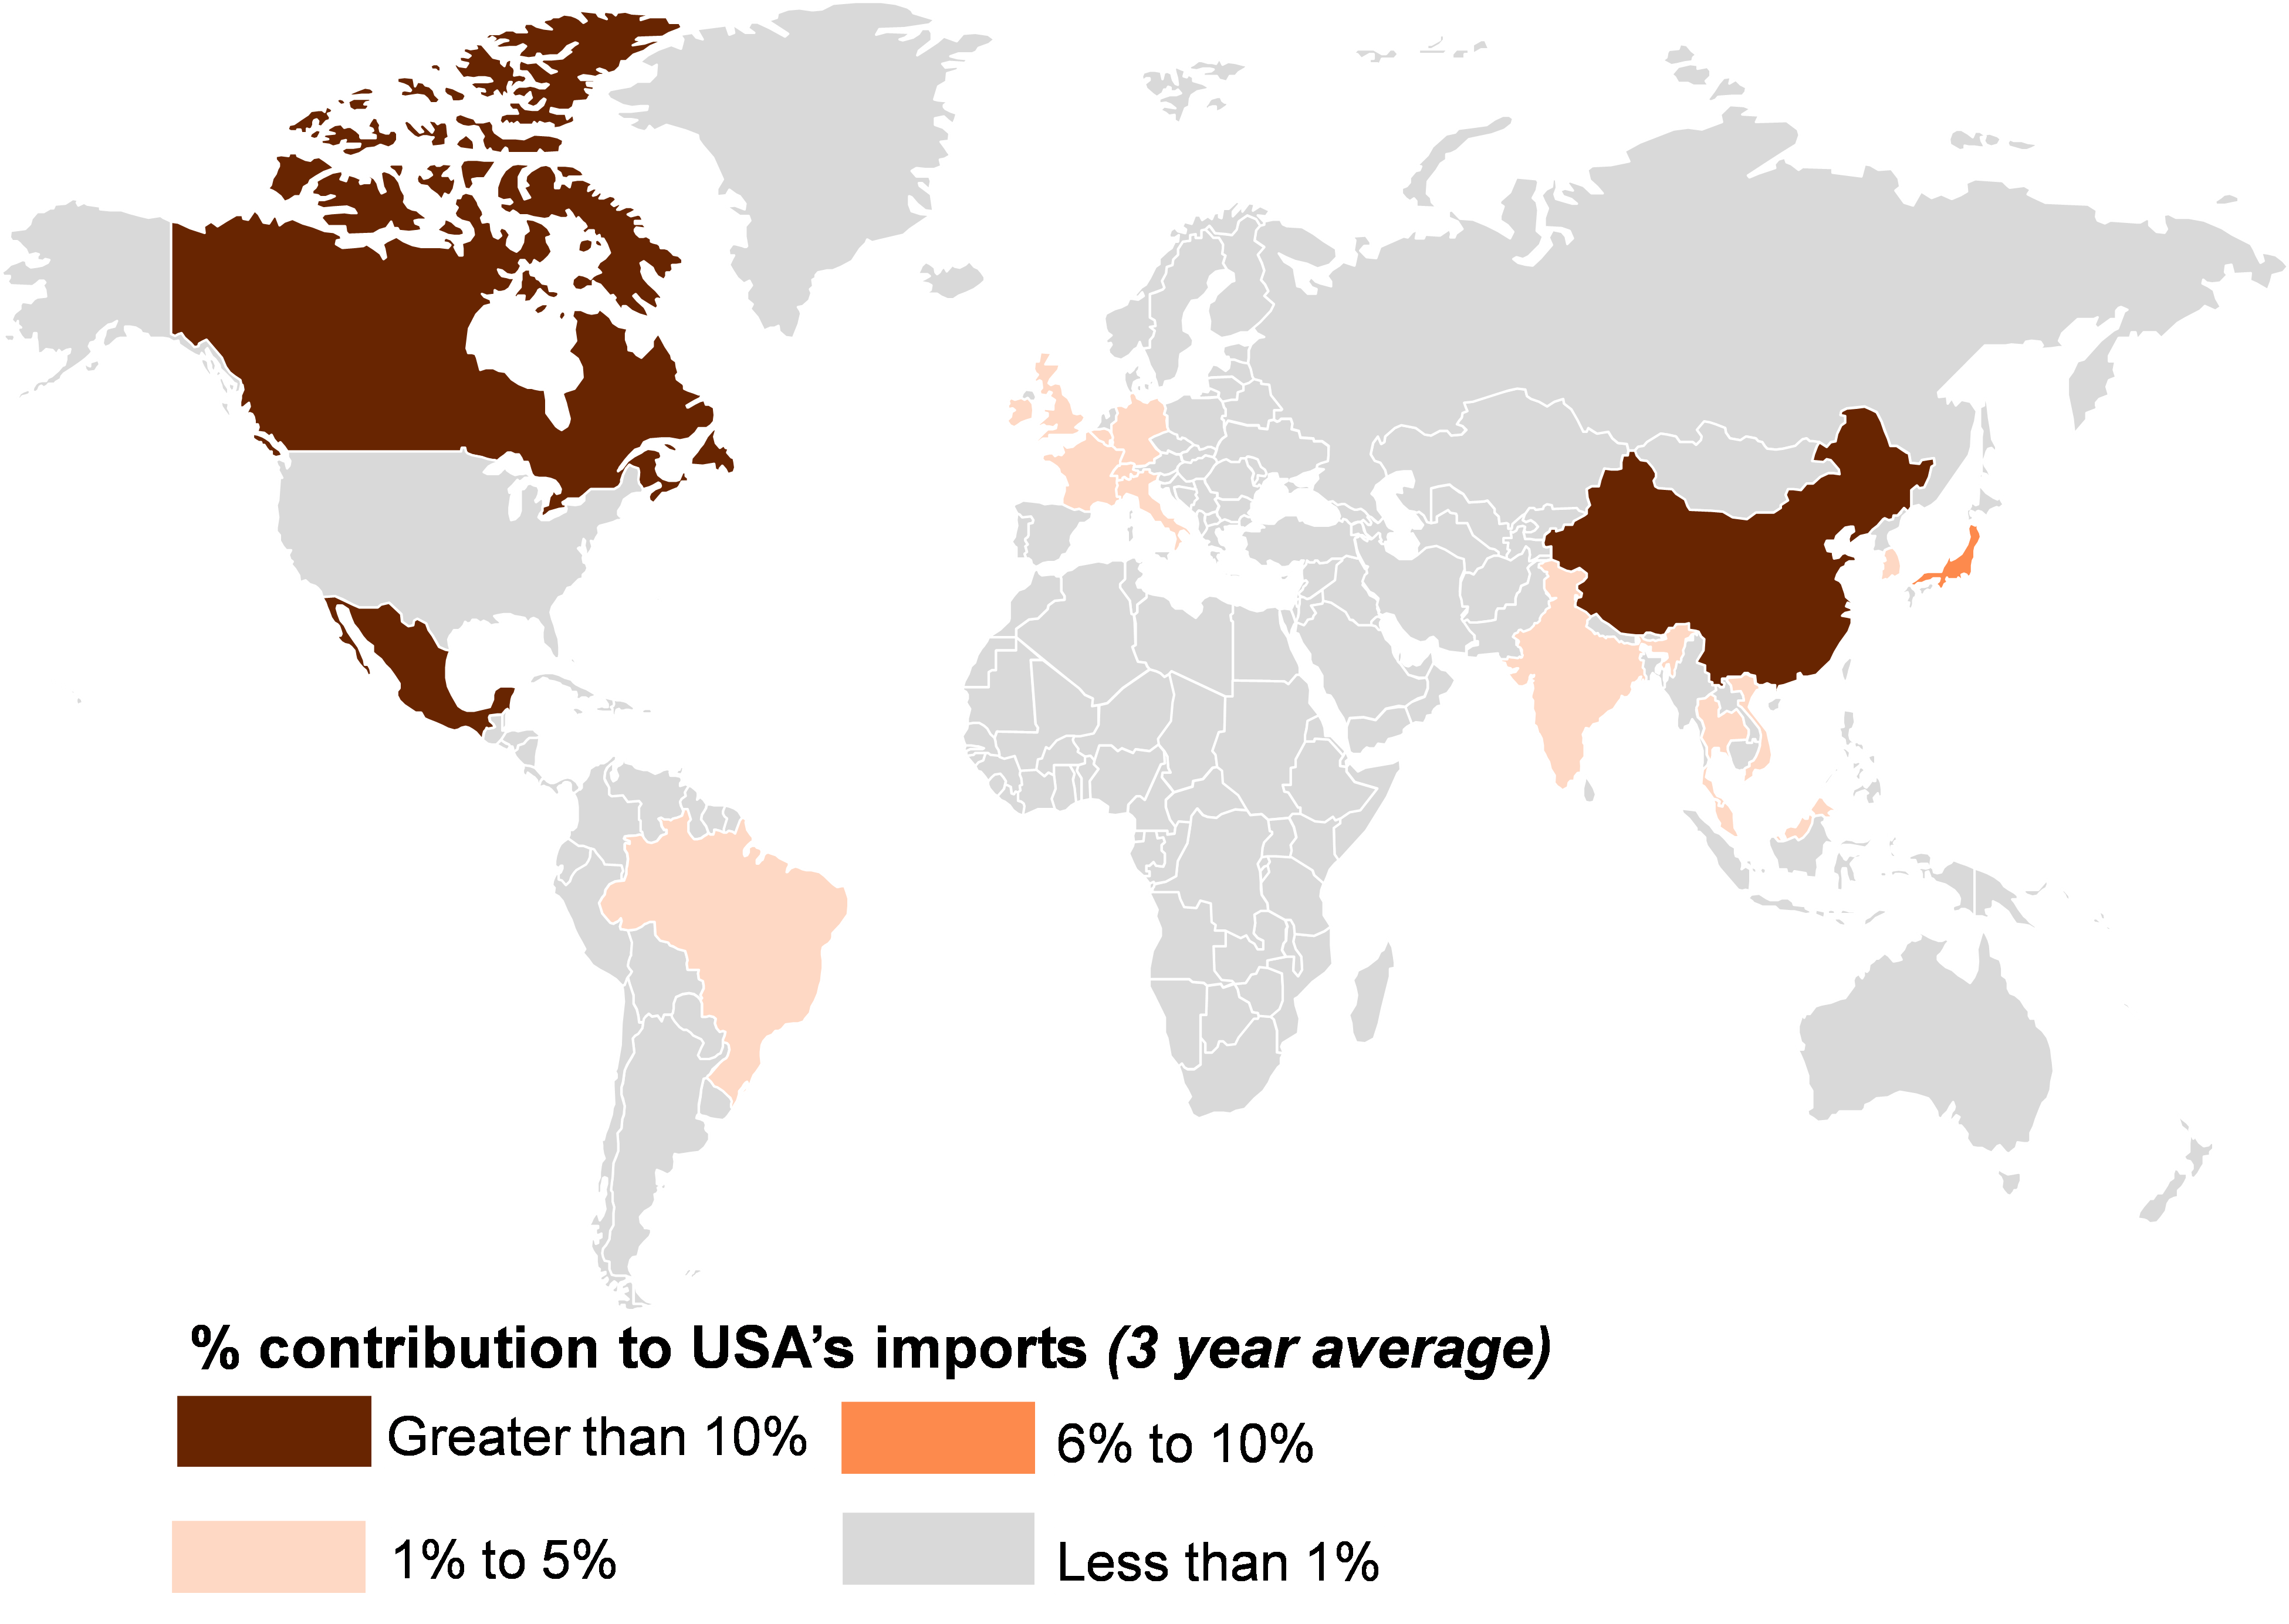
United States is a USD 2,447 Bn import market, which is largely serviced by exporters from China, Mexico and Canada. USA’s imports have grown from USD 2,249 Billion in 2016 to USD 2,564 Billion in 2019. In 2020, due to COVID induced disruptions in the global supply chains, USA’s imports contracted by ~6% to USD 2,407 Bn. India is the 10th largest exporter to USA and one of the key export destination for Uttar Pradesh.
China contributes to 20% of imports to USA. The top 10 countries contributing approximately 71% of imports to United States are China, USA, Mexico, Canada, Japan, Germany, Vietnam, South Korea, Switzerland, Ireland and India. On an average, India contributes to 2.2% of USA’s imports. A detailed list of key countries exporting to USA is attached in annexure 01.
The leading sectors that contribute to ~64% of USA’s imports are Machinery & equipment, Electricals & electronics, Vehicles & auto-components, mineral fuels, pharmaceuticals, Optical, photographic, cinematographic, medical & surgical devices, Gems & Jewellery, Furniture, Plastics & its articles, and Organic Chemicals.

The United States of America is ~USD 850 Billion market for service sector imports, with key focus towards travel, transport and professional services sector. The key professional services imported by the USA are business & management consulting services, public relations services, computer & software services, Research & development services, engineering services, etc. A detailed list of sectors contributing to ~95% of USA’s imports are detailed in the table below:
| HS Code | Product Description | 3 year average | % share |
|---|---|---|---|
| 'TOTAL | All Services | 849,654 | 100% |
| SOX1 | Memo item: Other commercial services | 304,357 | 36% |
| 4.2.3 | Travel, Personal, Other (other than health and education) | 94,716 | 11% |
| 3.2.1 | Passenger transport, Air | 47,944 | 6% |
| 6.2 | Reinsurance | 43,691 | 5% |
| 10.2.1.3 | Business and management consulting and public relations services | 37,236 | 4% |
| 7.1 | Explicitly charged and other financial services | 32,026 | 4% |
| 3.1.2 | Freight transport, Sea | 30,348 | 4% |
| 8.2 | Licences for the use of outcomes of research and development | 25,370 | 3% |
| 12 | Government goods and services n.i.e. | 23,007 | 3% |
| 9.2.2 | Computer services, Other (other than software) | 22,197 | 3% |
| 10.1.1.1 | R&D, Provision of customized and non-customized R&D services | 18,438 | 2% |
| 4.1.2 | Travel, Business, Other (other than acquisition of goods and services by border and short-term workers) | 17,377 | 2% |
| 10.1.2 | R&D, Other than work undertaken on a systematic basis to increase the stock of knowledge | 16,319 | 2% |
| 3.2.3 | Other transport, Air (other than passenger and freight) | 13,923 | 2% |
| 9.2.1 | Computer services, Software | 12,454 | 1% |
| 4.2.2 | Travel, Personal, Education-related | 11,480 | 1% |
| 8.3 | Licences to reproduce and/or distribute computer software | 10,909 | 1% |
| 10.3.5 | Other business services n.i.e. | 10,229 | 1% |
| 3.2.2 | Freight transport, Air | 8,449 | 1% |
| 2 | Maintenance and repair services n.i.e. | 7,672 | 1% |
| 7.2 | Financial intermediation services indirectly measured (FISIM) | 7,076 | 1% |
| 10.3.1.2 | Engineering services | 6,257 | 1% |
| 9.1 | Telecommunications services | 5,486 | 1% |
| 8.1 | Franchises and trademarks licensing fees | 4,638 | 1% |
| Others | 38,056 | 4% |
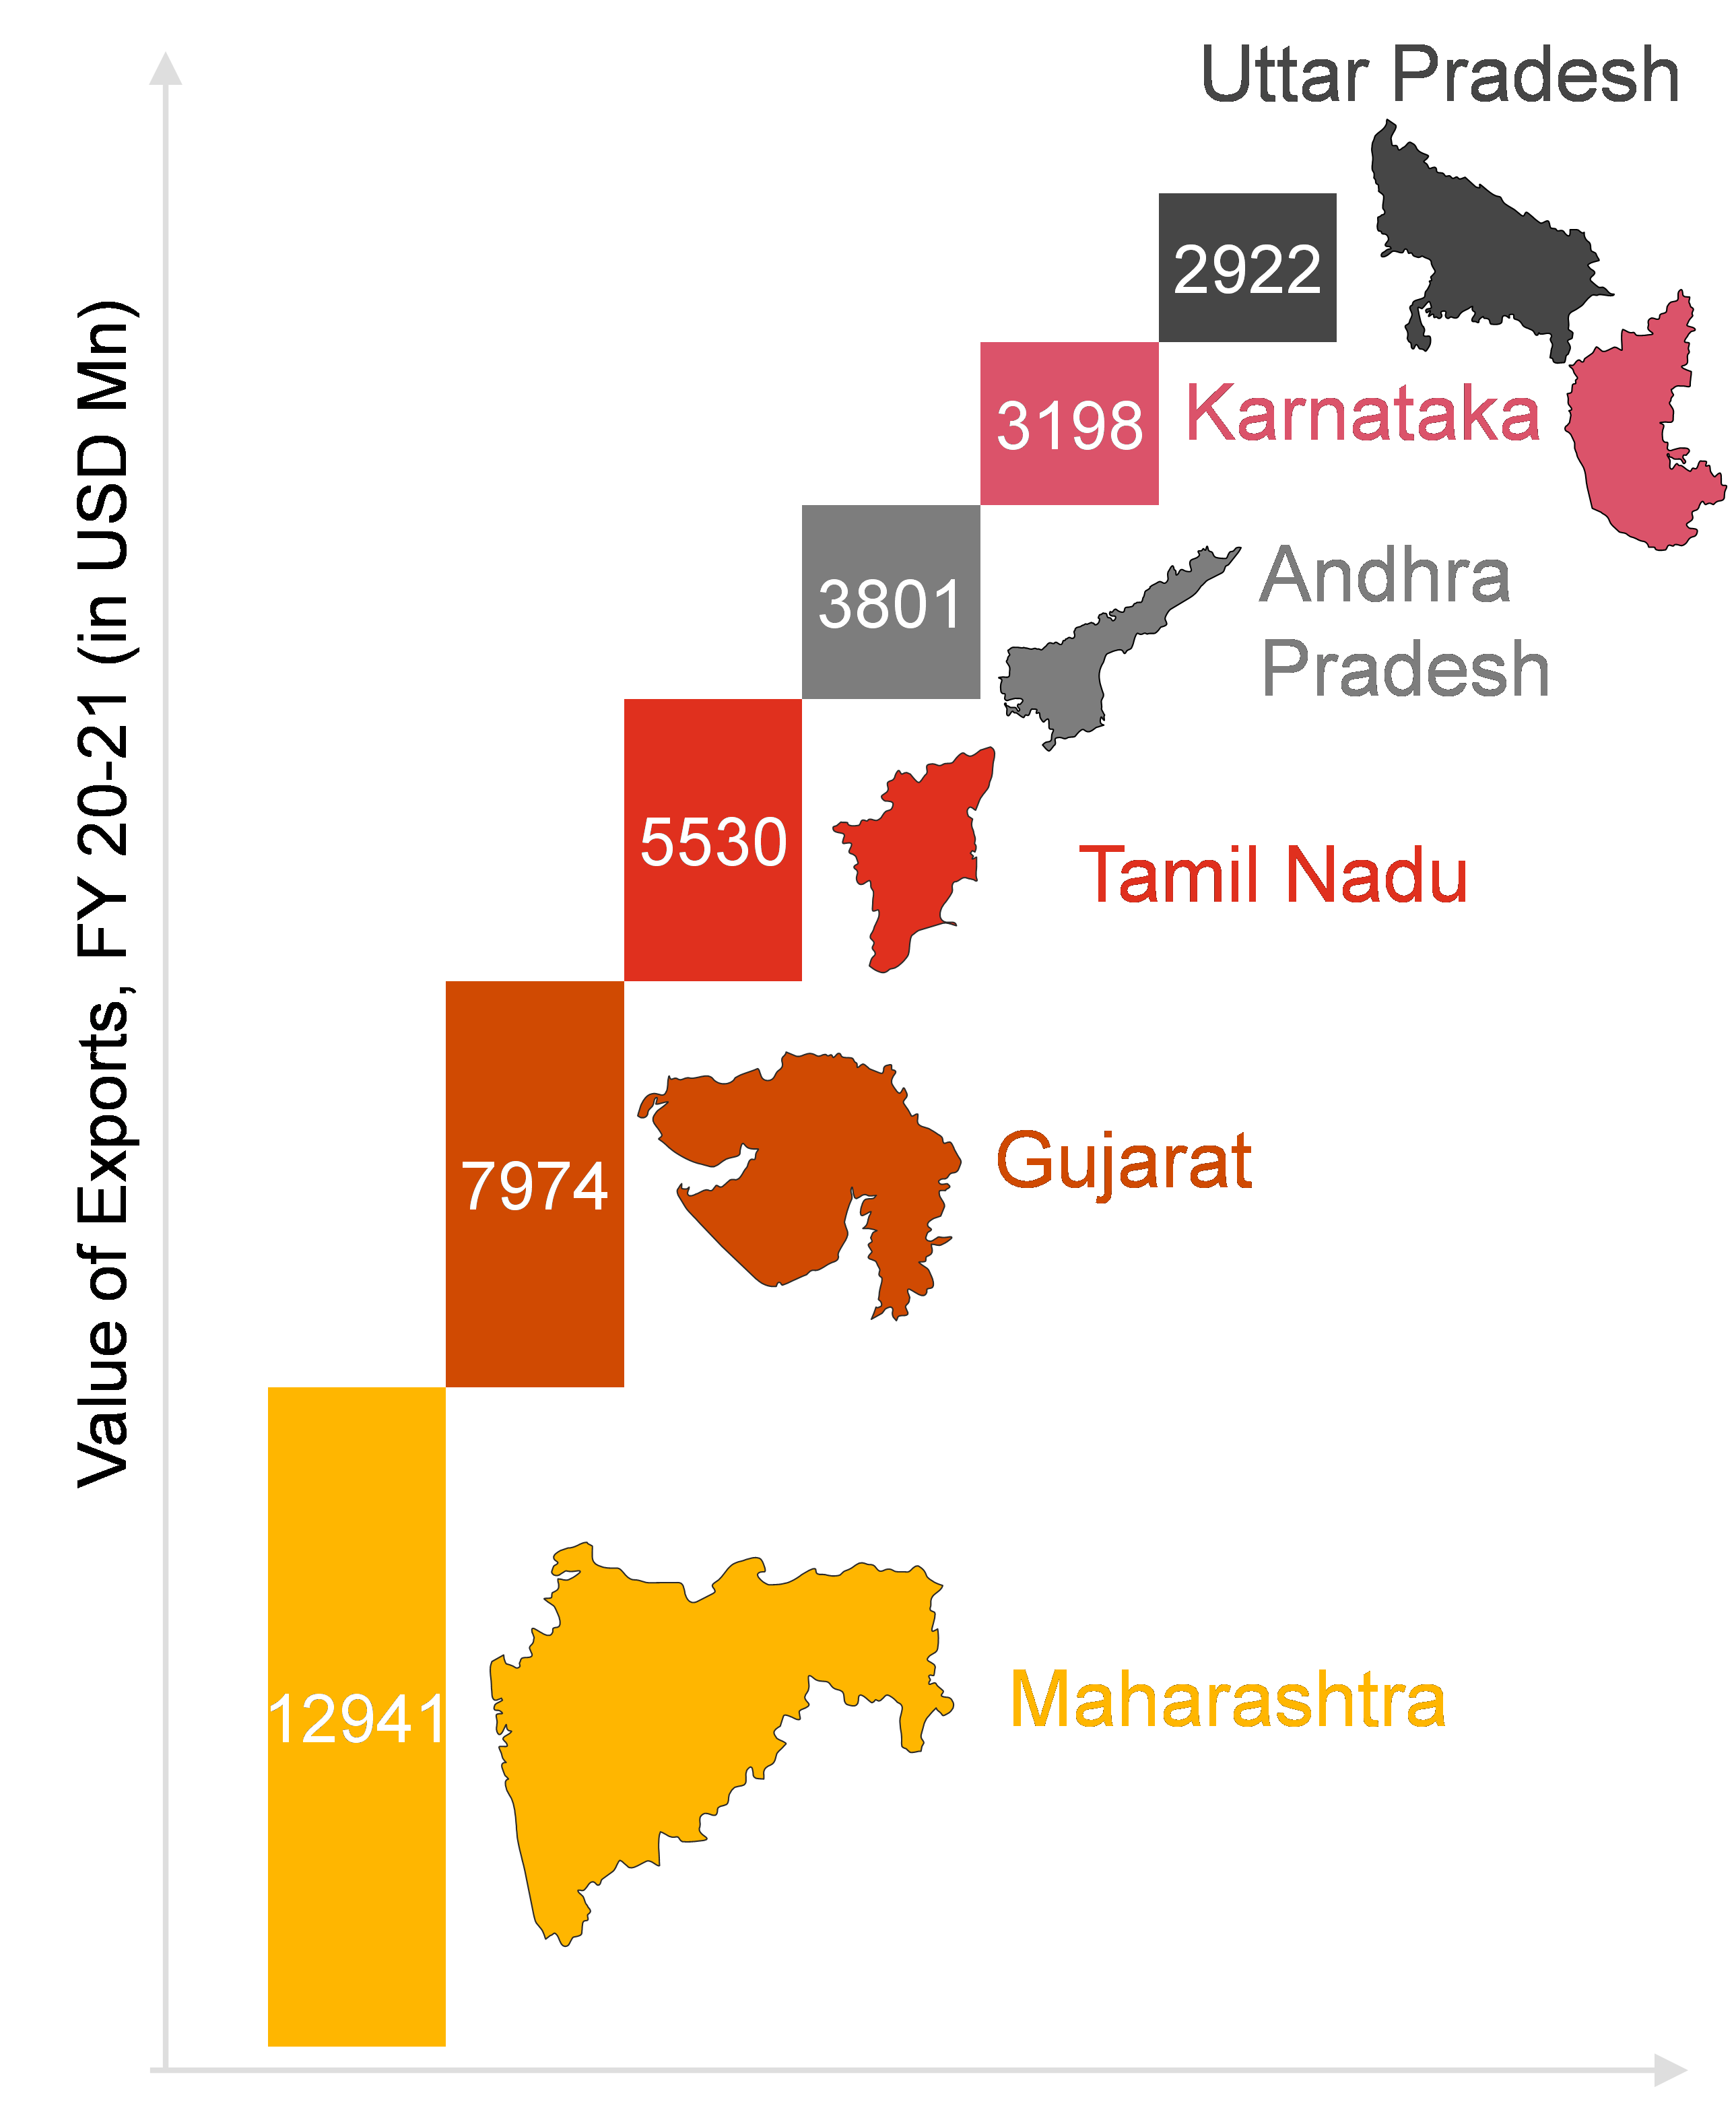
India is one of the largest trading partners of USA. India exports an average of USD 31 Billion value of commodities per year to USA accounting for a 2.3% share in USA’s imports in 2019. Maharashtra, Gujarat, Tamil Nadu, Andhra Pradesh, Karnataka and Uttar Pradesh are the top 5 states of India in terms of exports to United States, contributing approximately 70% of India’s exports to USA.
India’s export basket to USA is comprised of exports of the following top 10 sectors: Gems & Jewellery, Pharmaceuticals, Machinery & equipment, Apparels & textiles, Mineral fuels & its products, articles of iron and steels, electricals & electronics, road vehicles & auto-components, organic chemicals, Fish & other aquatic invertebrates as shown in table below. The table also discusses the percentage share of the sector in India’s exports to United States and the contribution of India’s exports in USA’s total imports of that sector at a HS 2 level. The sectors highlighted in yellow are the key sectors that are identified for driving the exports growth from Uttar Pradesh.
| Sector | India’s exports to USA, (USD Mn) | % share of sector in India’s exports globally | % share of India’s exports to USA’s imports |
|---|---|---|---|
| HS 71, Gems & Jewellery | 9.2 | 11% | 18% |
| HS 30, Pharmaceuticals | 6.1 | 5% | 12% |
| HS 84, Machinery & Equipment | 4.1 | 6% | 8% |
| HS 61 & 62, Apparels | 3.8 | 4% | 8% |
| HS 27, Mineral Fuels | 2.4 | 31% | 5% |
| HS 63, Made up textile articles | 2.5 | 2% | 5% |
| HS 87, Vehicles other than railway or tramway rolling stock | 2.6 | 5% | 5% |
| HS 29, Organic Chemicals | 1.9 | 6% | 4% |
| HS 03, Fish and crustaceans, mollusks and other aquatic invertebrates | 2.03 | 2% | 4% |
| HS 85, Electricals & electronics | 2.2 | 4% | 4% |
| Total exports (3 year average) | USD 52 Mn |
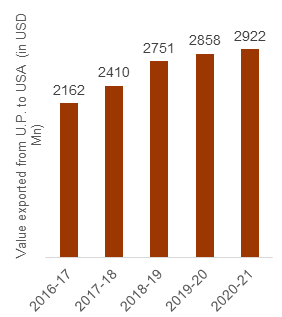
The exports from Uttar Pradesh to USA grew at a CAGR of 8% in the last 5 years. Uttar Pradesh exported a total of USD 2,922 Million value of commodities to United States in 2021. The resilience showcased by Uttar Pradesh’s exporters despite global supply chain disruptions during 2020-21, indicates a robust bilateral trade relationship between India and USA.
13 select sectors contributed to approximately 75% of UP’s exports to USA during the last 3 years. Export growth rate of 9 sectors in USA is higher than the growth rate of UP’s exports in all markets, thus acting as the drivers of Uttar Pradesh’s export growth in USA. The table below summarizes the top 12 products exported from UP to USA:
| HS code | Product description | Value of Exports (in USD Mn) | % share in UP’s exports to USA | Growth rate of exports from UP to USA | Growth rate of exports from UP to all markets |
|---|---|---|---|---|---|
| 57 | Carpets | 311.6 | 12% | 4.1% | 4% |
| 62 | Apparels, not knitted or crocheted | 306.6 | 11% | -1.9% | -9% |
| 73 | Articles of Iron & Steel | 279.7 | 10% | 20.0% | 10% |
| 94 | Furniture | 197.0 | 7% | 31.9% | 29% |
| 85 | Electrical machinery and equipment | 143.8 | 5% | 30.2% | 2% |
| 44 | Wood and articles of wood | 116.5 | 4% | 32.8% | 26% |
| 63 | Other made-up textile articles | 115.9 | 4% | 3.2% | 6% |
| 61 | Apparels, knitted or crocheted | 112.7 | 4% | -2.7% | -5% |
| 42 | Articles of leather | 89.7 | 3% | 8.2% | 2% |
| 87 | Vehicles & auto-components | 89.6 | 3% | 37.0% | 14% |
| 76 | Aluminum & articles thereof | 89.4 | 3% | 0.2% | 3% |
| 70 | Glass and Glassware | 85.3 | 3% | 17.3% | 4% |
| 84 | Nuclear reactors, boilers, machinery and mechanical appliances | 73.8 | 3% | 29.0% | 2% |
USA is one of the largest and fast-growing trade destination for the state of Uttar Pradesh. A congruence between the consumer demand and manufacturing capabilities of Uttar Pradesh is observed. This also indicates a high potential for exports growth.
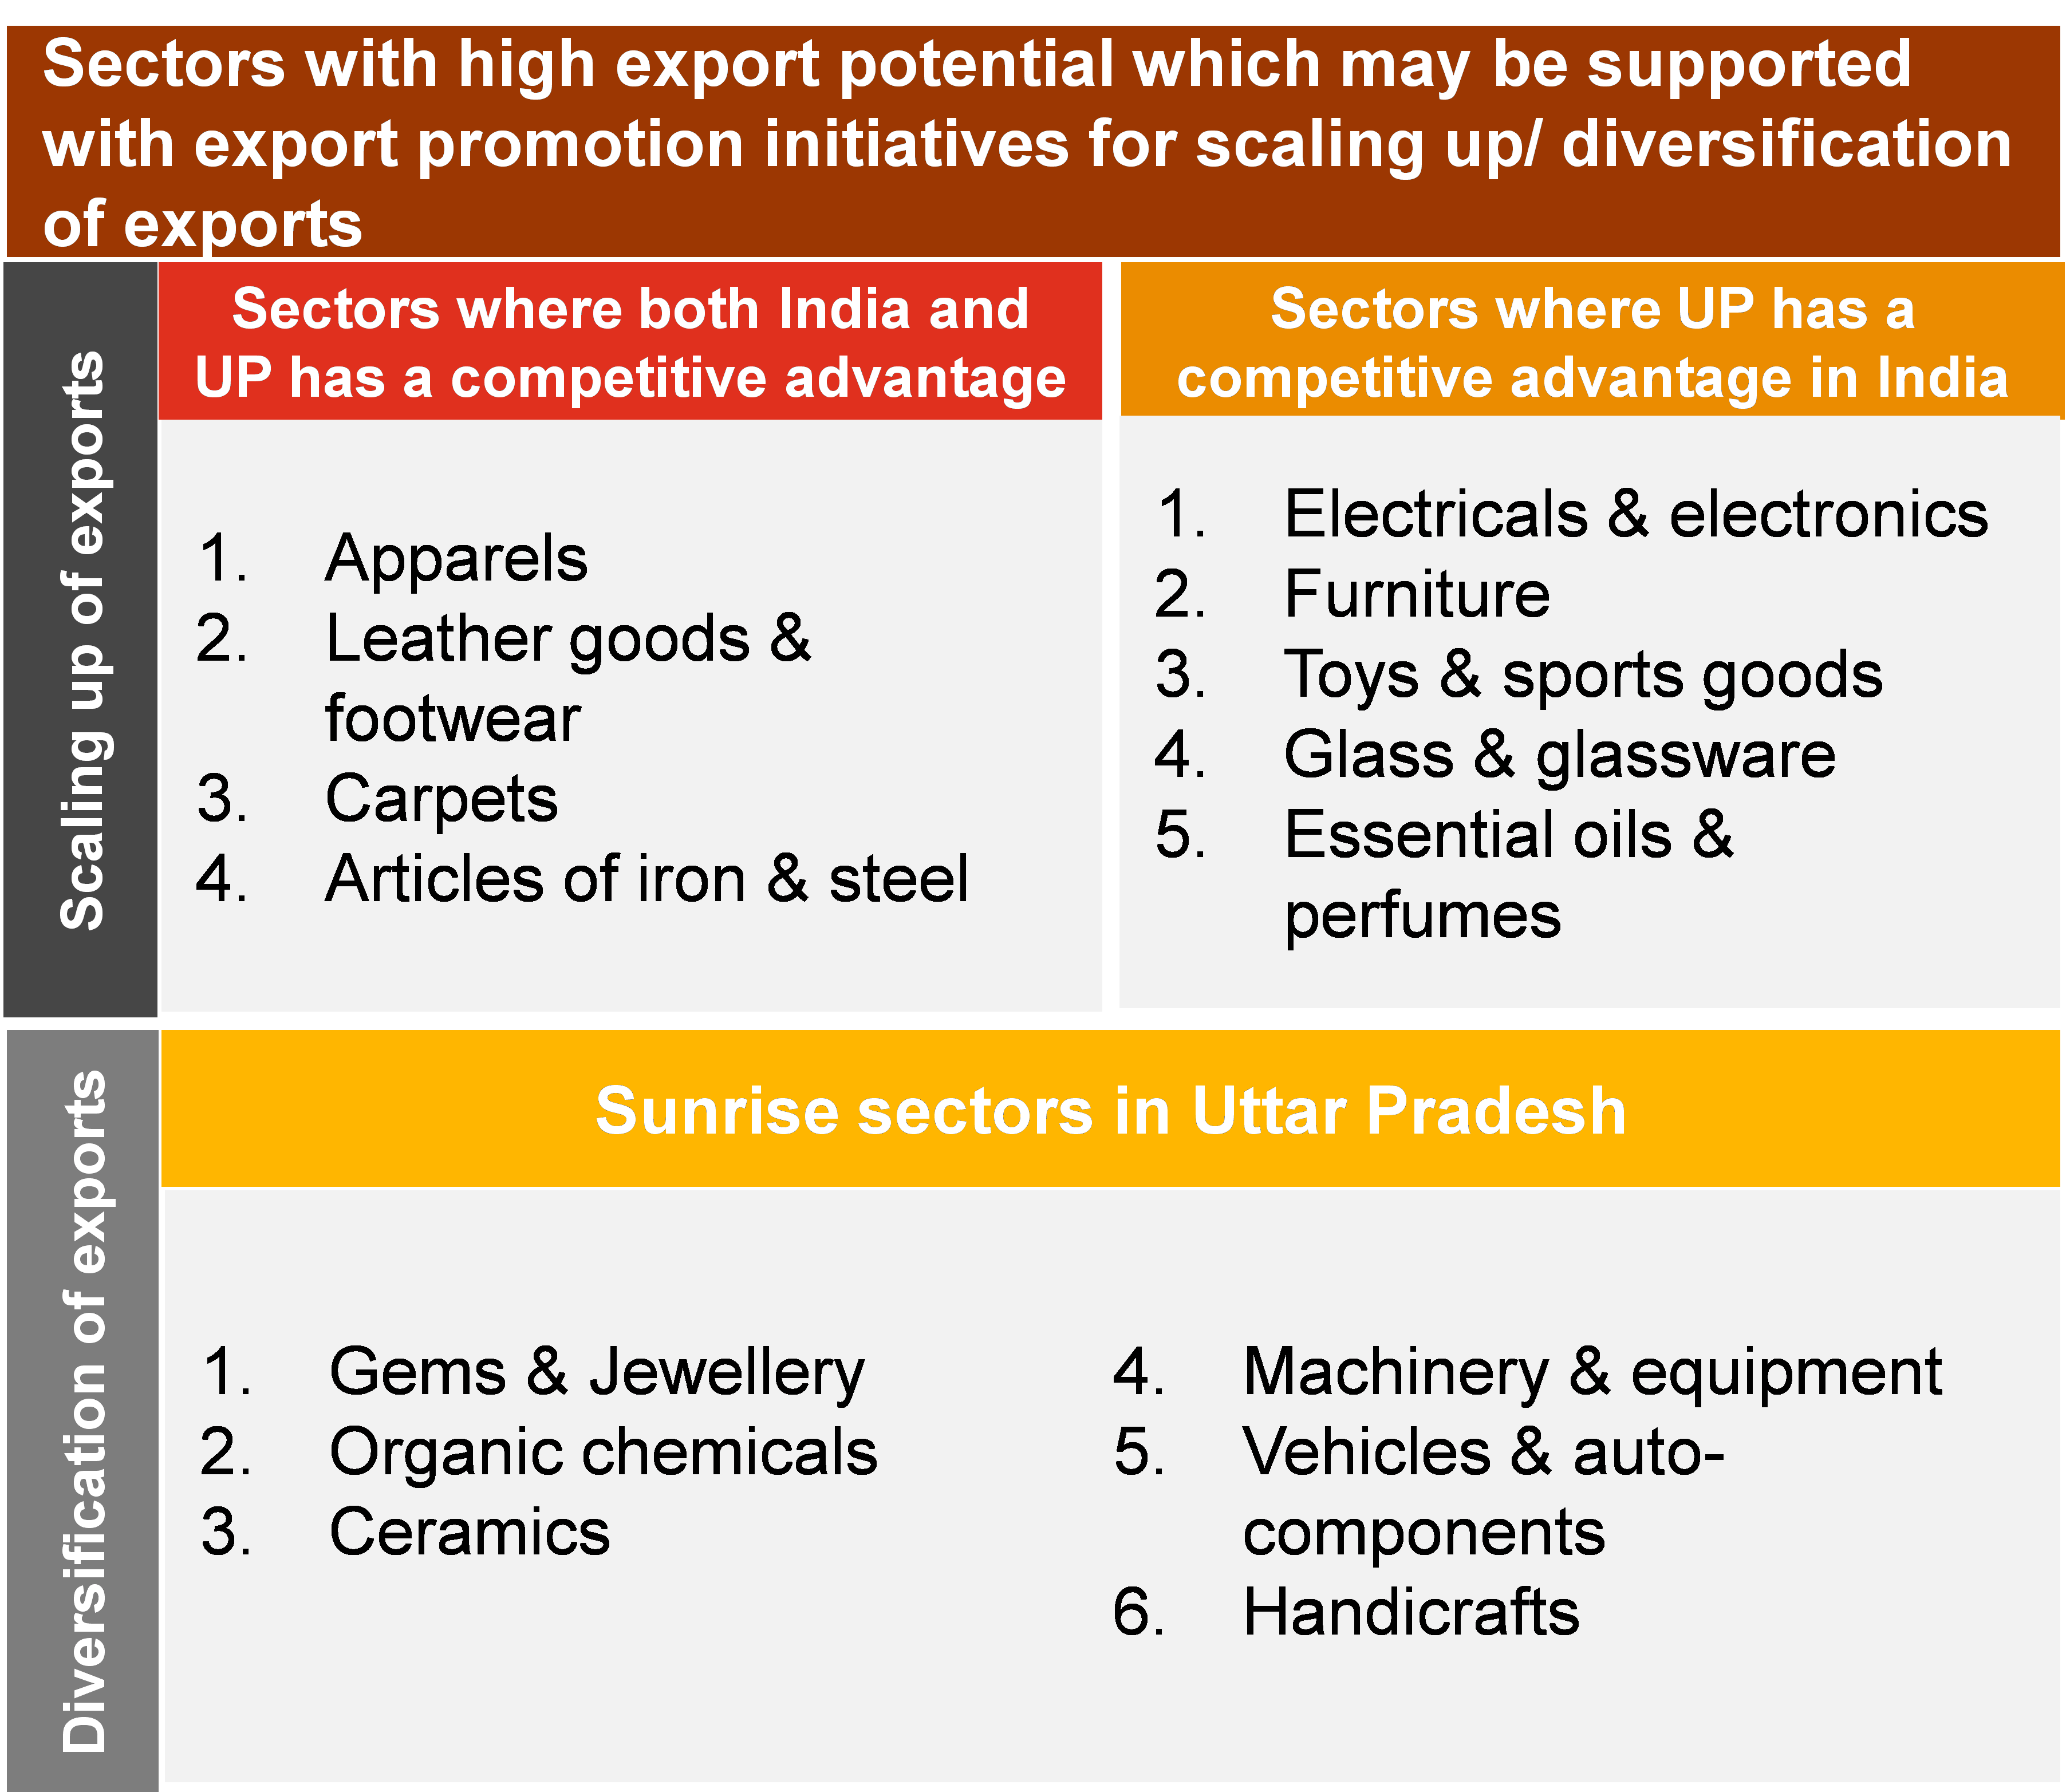
Uttar Pradesh’s export capabilities resonates with a large section of consumer demand in USA. The priority sectors are classified based on their RCA scores to identify the relevant export promotion strategies. The traditional sectors for which UP has a competitive advantage are selected for scaling up globally. Similarly, the sunrise sectors are selected for product development and market diversification to boost exports as shown in Figure 5. Select sectors that are key contributors to USA’s imports are also prioritized with the background of increasing exports from UP to USA. The priority sectors shortlisted are also classified into two categories, based on relevant strategy for export promotion. The sectors with significant manufacturing and exports volume to USA are strategically selected for scaling up of exports. The sectors with appreciable manufacturing volume, but low level of exports from UP to USA are selected for market diversification into USA. The selection of sectors is based on their import demand, India’s and UP’s exports to the United States of America. The table below summarizes the top 10 sectors shortlisted for UP’s exporters who intend to undertake exports in USA. Machinery, mechanical appliances & equipment, Electricals & electronics, Vehicles & auto-components, Apparels and Furniture are shortlisted for scaling up in USA. Similarly, Pharmaceutics, Optical, photographic, cinematographic & medical instruments, Gems & Jewellery, Plastics & its articles and Organic Chemicals are shortlisted for market diversification into USA. A comprehensive detail for the select 10 sectors at a HS 6 level is described in annexure 3. The export trends are analyzed to identify country level strategies for export promotion as described in table 3. Further, to support exporters of the state in scaling of exports, the government of Uttar Pradesh through Export Promotion Bureau – Uttar Pradesh and Uttar Pradesh Export Promotion Council has planned to undertake the following initiatives: 1. Identifying and connecting with Sectoral bodies (for priority sectors) based in USA 2. Identifying importers and their sourcing needs 3. List of key events where UP's exporters shall participate 4. Facilitate visit of USA’s Importers to UP in key trade events that may be organized by Government of Uttar Pradesh 5. Identification of online platforms where UP's exporters should register for exporting their products to meet sourcing requirements of USA’s importers
| HS Code | Product Description | Value imported by USA (USD Mn) | Exports from India to USA (USD Mn) | UP’s exports to USA (USD Mn) | Potential intervention strategy |
|---|---|---|---|---|---|
| 84 | Machinery, mechanical appliances and equipment | 374,676 | 4193 | 73.8 | Scaling up |
| 85 | Electrical machinery & electronics | 353,569 | 2,344 | 133 | Scaling up |
| 87 | Vehicles & Auto-components | 290,056 | 2,502 | 80 | Scaling up |
| 30 | Pharmaceutical products | 127,697 | 6,300 | 36 | Diversification |
| 90 | Optical, photographic, cinematographic devices | 93,478 | 587 | 26 | Diversification |
| 61 & 62 | Apparels | 81,749 | 3900 | 455 | Scaling up |
| 71 | Gems & Jewellery | 75,271 | 9,472 | 14 | Diversification |
| 94 | Furniture | 68,052 | 780 | 187 | Scaling up |
| 39 | Plastics and its articles | 61,472 | 870 | 29 | Diversification |
| 29 | Organic chemicals | 55,253 | 1957 | 59 | Diversification |
| 84 | Machinery & equipment | 24,400 | 456.4 | 4.9 | Diversification |
| 71 | Gems & Jewellery | 17,505 | 613.4 | 0.3 | Diversification |
| 85 | Electricals & Electronics | 16,386 | 346.8 | 74.6 | Scale up |
| 87 | Vehicles & auto-components | 13,065 | 308.5 | 21 | Scale up |
| 42 & 64 | Leather goods and footwear | 842 | 4.1 | 0.4 | Diversification |
| 29 | Organic Chemicals | 5,942 | 437 | 3.2 | Diversification |
| 73 | Articles of iron & steel | 2,630 | 36.9 | 1.4 | Diversification |
| 61 & 62 | Apparels | 1505 | 40.4 | 3.2 | Diversification |
| 33 | Essential oils & perfumes | 1,188 | 8.3 | 0.6 | Diversification |
| 70 | Glass & glassware | 799 | 11.7 | 1.56 | Diversification |
| Exporters | Imported value in 2018 | Imported value in 2019 | Imported value in 2020 | 3 year average | % share |
|---|---|---|---|---|---|
| Total | 2,609,127 | 2,563,536 | 2,406,932 | 2,526,532 | 100% |
| China | 562,700 | 470,951 | 456,449 | 496,700 | 20% |
| Mexico | 347,334 | 359,340 | 328,685 | 345,120 | 14% |
| Canada | 325,887 | 326,157 | 277,302 | 309,782 | 12% |
| Japan | 145,685 | 146,922 | 122,471 | 138,359 | 5% |
| Germany | 128,335 | 129,912 | 117,361 | 125,202 | 5% |
| Viet Nam | 51,261 | 69,159 | 83,184 | 67,868 | 3% |
| Korea, Republic of | 76,184 | 79,939 | 78,359 | 78,160 | 3% |
| Switzerland | 41,696 | 45,470 | 75,623 | 54,263 | 2% |
| Ireland | 57,675 | 62,111 | 66,322 | 62,036 | 2% |
| Taipei, Chinese | 47,236 | 55,927 | 62,456 | 55,206 | 2% |
| India | 56,373 | 60,139 | 53,580 | 56,698 | 2% |
| United Kingdom | 61,764 | 64,329 | 51,194 | 59,096 | 2% |
| Italy | 56,216 | 58,851 | 50,964 | 55,344 | 2% |
| Malaysia | 40,127 | 41,440 | 45,298 | 42,288 | 2% |
| France | 53,634 | 58,649 | 43,804 | 52,029 | 2% |
| Thailand | 33,017 | 34,754 | 39,232 | 35,668 | 1% |
| Singapore | 26,791 | 26,690 | 31,126 | 28,202 | 1% |
| Netherlands | 25,287 | 30,753 | 28,141 | 28,060 | 1% |
| Brazil | 32,395 | 32,164 | 24,508 | 29,689 | 1% |
| Belgium | 17,871 | 20,658 | 21,289 | 19,939 | 1% |
| Others | 421,659 | 389,221 | 349,584 | 386,823 | 15% |
| HS Code | Product Description | Imported value in 2018 | Imported value in 2019 | Imported value in 2020 | 3 year average | % share |
|---|---|---|---|---|---|---|
| 'TOTAL | All products | 2,609,127 | 2,563,536 | 2,406,932 | 2,526,532 | 100% |
| '27 | Mineral fuels, mineral oils and products of their distillation; bituminous substances; mineral waxes | 241,667 | 209,785 | 130,630 | 42,265 | 24% |
| '87 | Vehicles other than railway or tramway rolling stock, and parts and accessories thereof | 306,130 | 309,650 | 254,387 | 23,779 | 13% |
| '71 | Natural or cultured pearls, precious or semi-precious stones, precious metals, metals clad with precious metal, and articles thereof; imitation jewellery; coin | 60,765 | 58,060 | 106,987 | 21,144 | 12% |
| '84 | Machinery, mechanical appliances, nuclear reactors, boilers; parts thereof | 384,982 | 377,873 | 361,174 | 9,002 | 5% |
| '85 | Electrical machinery and equipment and parts thereof; sound recorders and reproducers, television image and sound recorders and reproducers, and parts and accessories of such articles | 366,232 | 351,074 | 343,401 | 8,442 | 5% |
| '30 | Pharmaceutical products | 115,525 | 128,135 | 139,431 | 8,115 | 5% |
| '63 | Other made-up textile articles; sets; worn clothing and worn textile articles; rags | 16,138 | 16,743 | 31,249 | 6,581 | 4% |
| '99 | Commodities not elsewhere specified | 101,561 | 113,603 | 102,479 | 5,148 | 3% |
| '61 | Articles of apparel and clothing accessories, knitted or crocheted | 47,682 | 48,160 | 38,254 | 4,296 | 2% |
| '72 | Iron and steel | 31,036 | 24,483 | 18,800 | 4,175 | 2% |
| '97 | Works of art, collectors' pieces and antiques | 11,857 | 11,828 | 5,278 | 2,917 | 2% |
| '64 | Footwear, gaiters and the like; parts of such articles | 27,536 | 28,171 | 21,504 | 2,822 | 2% |
| '62 | Articles of apparel and clothing accessories, not knitted or crocheted | 39,015 | 39,224 | 32,912 | 2,759 | 2% |
| '73 | Articles of iron or steel | 43,146 | 40,887 | 35,987 | 2,680 | 2% |
| '94 | Furniture; bedding, mattresses, mattress supports, cushions and similar stuffed furnishings; lamps and lighting fittings, not elsewhere specified or included; illuminated signs, illuminated nameplates and the like; prefabricated buildings | 71,857 | 66,842 | 65,458 | 2,536 | 1% |
| '88 | Aircraft, spacecraft, and parts thereof | 31,920 | 35,447 | 28,377 | 2,358 | 1% |
| '90 | Optical, photographic, cinematographic, measuring, checking, precision, medical or surgical instruments and apparatus; parts and accessories thereof | 93,313 | 96,567 | 90,552 | 2,060 | 1% |
| '76 | Aluminium and articles thereof | 24,219 | 22,238 | 19,045 | 1,859 | 1% |
| '42 | Articles of leather; saddlery and harness; travel goods, handbags and similar containers; articles of animal gut (other than silkworm gut) | 14,349 | 13,254 | 10,177 | 1,611 | 1% |
| '44 | Wood and articles of wood; wood charcoal | 22,575 | 19,205 | 22,578 | 1,499 | 1% |
| '38 | Miscellaneous chemical products | 15,299 | 14,963 | 18,474 | 1,486 | 1% |
| '28 | Inorganic chemicals; organic or inorganic compounds of precious metals, of rare-earth metals, of radioactive elements or of isotopes | 13,330 | 12,779 | 10,337 | 1,208 | 1% |
| '95 | Toys, games and sports requisites; parts and accessories thereof | 34,377 | 33,961 | 36,344 | 967 | 1% |
| Others | 241,667 | 209,785 | 130,630 | 42,265 | 14% |
| HS Code (6 digit) | Product Description | Share in USA’s import at the HS 2 level | Average share in global imports at HS2 level | Global exports by India | India’s share in global exports | Global exports by Uttar Pradesh |
|---|---|---|---|---|---|---|
| HS 84 – Machinery, mechanical appliances and equipment | ||||||
| '847130 | Data-processing machines, automatic, portable, weighing <= 10 kg, consisting of at least a central processing unit, a keyboard and a display (excluding peripheral units) | 12.5% | 7.2% | 35.22 | 0.0% | 0.64 |
| '847150 | Processing units for automatic data-processing machines, whether or not containing in the same housing one or two of the following types of unit: storage units, input units, output units (excluding those of heading 8471.41 or 8471.49 and excluding peripheral units) | 8.6% | 3.6% | 46.17 | 0.1% | 0.5 |
| '847330 | Parts and accessories of automatic data-processing machines or for other machines of heading 8471, n.e.s. | 5.7% | 5.7% | 101.60 | 0.1% | 7.6 |
| '841191 | Parts of turbojets or turbopropellers, n.e.s. | 3.4% | 3.2% | 100.54 | 0.2% | 0 |
| '841112 | Turbojets of a thrust > 25 kN | 2.5% | 2.6% | 2861.06 | 5.9% | 0.52 |
| '840734 | Spark-ignition reciprocating piston engine, of a kind used for vehicles of chapter 87, of a cylinder capacity > 1.000 cm³ | 2.2% | 1.4% | 116.13 | 0.4% | 0.02 |
| '848180 | Appliances for pipes, boiler shells, tanks, vats or the like (excluding pressure-reducing valves, valves for the control of pneumatic power transmission, check "non-return" valves and safety or relief valves) | 2.2% | 2.4% | 821.51 | 1.6% | 17.08 |
| '847170 | Storage units for automatic data-processing machines | 2.2% | 3.5% | 23.83 | 0.0% | 0.1 |
| '844399 | Parts and accessories of printers, copying machines and facsimile machines, n.e.s. (excluding of printing machinery used for printing by means of plates, cylinders and other printing components of heading 8442) | 2.1% | 2.1% | 33.77 | 0.1% | 4.38 |
| '840991 | Parts suitable for use solely or principally with spark-ignition internal combustion piston engine, n.e.s. | 1.5% | 1.3% | 302.77 | 1.0% | 26.7 |
| Total of 10 commodity | 42.9% | 4442.6 | 57.54 | |||
| Rest of the commodities under HS code 84 | 57.1% | 19690 | 621 | |||
| HS 85 – Electrical & Electronics | ||||||
| '851712 | Telephones for cellular networks "mobile telephones" or for other wireless networks | 14.99% | 9.4% | 3197.39 | 1.2% | 2244.6 |
| '851762 | Machines for the reception, conversion and transmission or regeneration of voice, images or other data, incl. switching and routing apparatus (excluding telephone sets, telephones for cellular networks or for other wireless networks) | 11.31% | 5.8% | 537.46 | 0.3% | 5.6 |
| '854231 | Electronic integrated circuits as processors and controllers, whether or not combined with memories, converters, logic circuits, amplifiers, clock and timing circuits, or other circuits | 6.19% | 12.6% | 102.15 | 0.0% | 36.2 |
| '852872 | Reception apparatus for television, colour, whether or not incorporating radio-broadcast receivers or sound or video recording or reproducing apparatus, designed to incorporate a video display or screen | 3.73% | 1.5% | 4.64 | 0.0% | 0.9 |
| '853710 | Boards, cabinets and similar combinations of apparatus for electric control or the distribution of electricity, for a voltage <= 1.000 V | 3.58% | 2.0% | 430.54 | 0.7% | 7.2 |
| '852351 | Solid-state, non-volatile data storage devices for recording data from an external source [flash memory cards or flash electronic storage cards] (excluding goods of chapter 37) | 3.34% | 1.2% | 35.5 | 0.1% | 0.42 |
| '850440 | Static converters | 3.03% | 2.2% | 1122 | 1.8% | 13 |
| '854430 | Ignition wiring sets and other wiring sets for vehicles, aircraft or ships | 3.00% | 1.4% | 213.34 | 0.6% | 61.4 |
| '854140 | Photosensitive semiconductor devices, incl. photovoltaic cells whether or not assembled in modules or made up into panels; light emitting diodes (excluding photovoltaic generators) | 2.72% | 2.0% | 195.48 | 0.3% | 8.3 |
| '854239 | Electronic integrated circuits (excluding such as processors, controllers, memories and amplifiers) | 2.27% | 9.4% | 133.86 | 0.1% | 73.6 |
| Total of top 10 commodities | 54.17% | 2774.94 | 5.17% | |||
| Rest of the commodities under HS code 85 | 45.83 | 14191 | 94.83 | |||
| HS 87 – Vehicles & auto-mobiles | ||||||
| '870323 | Motor cars and other motor vehicles principally designed for the transport of persons, incl. station wagons and racing cars, with spark-ignition internal combustion reciprocating piston engine of a cylinder capacity > 1.500 cm³ but <= 3.000 cm³ (excluding vehicles for the transport of persons on snow and other specially designed vehicles of subheading 8703.10) | 33.1% | 18.0% | 1681.86 | 0.7% | 0 |
| '870324 | Motor cars and other motor vehicles principally designed for the transport of persons, incl. station wagons and racing cars, with spark-ignition internal combustion reciprocating piston engine of a cylinder capacity > 3.000 cm³ (excluding vehicles for the transport of persons on snow and other specially designed vehicles of subheading 8703.10) | 12.1% | 5.7% | 2.10 | 0.0% | 0 |
| '870322 | Motor cars and other motor vehicles principally designed for the transport of persons, incl. station wagons and racing cars, with spark-ignition internal combustion reciprocating piston engine of a cylinder capacity > 1.000 cm³ but <= 1.500 cm³ (excluding vehicles for the transport of persons on snow and other specially designed vehicles of subheading 8703.10) | 6.9% | 8.0% | 2562.7 | 2.5% | 2.7 |
| '870431 | Motor vehicles for the transport of goods, with spark-ignition internal combustion piston engine, of a gross vehicle weight <= 5 t (excluding dumpers for off-highway use of subheading 8704.10 and special purpose motor vehicles of heading 8705) | 6.1% | 2.4% | 5.59 | 0.0% | 0 |
| '870829 | Parts and accessories of bodies for tractors, motor vehicles for the transport of ten or more persons, motor cars and other motor vehicles principally designed for the transport of persons, motor vehicles for the transport of goods and special purpose motor vehicles (excluding bumpers and parts thereof and safety seat belts) | 4.9% | 5.2% | 156.49 | 0.2% | 0.42 |
| '870899 | Parts and accessories, for tractors, motor vehicles for the transport of ten or more persons, motor cars and other motor vehicles principally designed for the transport of persons, motor vehicles for the transport of goods and special purpose motor vehicles, n.e.s. | 4.8% | 5.8% | 2380.69 | 2.9% | 115.6 |
| Total of top 6 commodities | 67.9% | 6789.43 | 118.72 | |||
| Rest of the commodities under HS code 87 | 32.1% | 15325 | 474.25 | |||
| HS 30 - Pharmaceuticals | ||||||
| '300490 | Medicaments consisting of mixed or unmixed products for therapeutic or prophylactic purposes, put up in measured doses "incl. those in the form of transdermal administration" or in forms or packings for retail sale (excluding medicaments containing antibiotics, medicaments containing hormones or steroids used as hormones, but not containing antibiotics, medicaments containing alkaloids or derivatives thereof but not containing hormones or antibiotics and medicaments containing provitamins, vitamins or derivatives thereof used as vitamins) | 46.4% | 48.5% | 13224.94 | 4.4% | 71.6 |
| '300215 | Immunological products, put up in measured doses or in forms or packings for retail sale | 18.9% | 16.3% | 150.76 | 0.1% | 0.05 |
| '300439 | Medicaments containing hormones or steroids used as hormones but not antibiotics, put up in measured doses "incl. those in the form of transdermal administration" or in forms or packings for retail sale (excluding medicaments containing insulin or corticosteroid hormones, their derivatives or structural analogues) | 6.9% | 5.2% | 93.25 | 0.3% | 0.25 |
| Total of top 3 commodities | 72.2% | 3468.95 | 1.9 | |||
| Rest of the commodities under HS code 30 | 27.8% | 7296 | 41.1 | |||
| HS 90 - Optical, photographic, cinematographic | ||||||
| '901890 | Instruments and appliances used in medical, surgical or veterinary sciences, n.e.s. | 14.2% | 10.1% | 294.59 | 0.5% | 6.51 |
| '901839 | Needles, catheters, cannulae and the like, used in medical, surgical, dental or veterinary sciences (excluding syringes, tubular metal needles and needles for sutures) | 6.3% | 4.9% | 319.01 | 1.0% | 18.2 |
| '901819 | Electro-diagnostic apparatus, incl. apparatus for functional exploratory examination or for checking physiological parameters (excluding electro-cardiographs, ultrasonic scanning apparatus, magnetic resonance imaging apparatus and scintigraphic apparatus) | 4.1% | 2.3% | 97.93 | 0.7% | 0.12 |
| '902139 | Artificial parts of the body (excluding artificial teeth and dental fittings and artificial joints) | 3.8% | 2.2% | 44.81 | 0.4% | 0.76 |
| '901920 | Ozone therapy, oxygen therapy, aerosol therapy, artificial respiration or other therapeutic respiration apparatus | 3.3% | 2.0% | 9.23 | 0.1% | 0.63 |
| '902131 | Artificial joints for orthopaedic purposes | 2.9% | 1.7% | 21.78 | 0.2% | 0.7 |
| '903289 | Regulating or controlling instruments and apparatus (excluding hydraulic or pneumatic, manostats, thermostats, and taps, cocks and valves of heading 8481) | 2.8% | 3.8% | 217.51 | 1.0% | 2.28 |
| '903180 | Instruments, appliances and machines for measuring or checking, not elsewhere specified in chapter 90 (excluding optical) | 2.7% | 4.1% | 101.83 | 0.5% | 4.44 |
| '902110 | Orthopaedic or fracture appliances | 2.6% | 1.8% | 50.08 | 0.5% | 1.74 |
| '901380 | Liquid crystal devices, n.e.s. and other optical appliances and instruments not elsewhere specified in chapter 90 | 2.4% | 5.7% | 5.93 | 0.0% | 0.8 |
| Total of top 10 commodities | 45% | 1162.7 | 39.57 | |||
| Rest of the commodities under HS code 90 | 55% | 3251 | 135.2 | |||
| HS 71 – Gems and Jewelry | ||||||
| '710812 | Gold, incl. gold plated with platinum, unwrought, for non-monetary purposes (excluding gold in powder form) | 23.8% | 37.6% | 175.41 | 0.1% | 0 |
| '711590 | Articles of precious metal or of metal clad with precious metal, n.e.s. | 16.9% | 2.3% | 0.56 | 0.0% | 0 |
| '710239 | Diamonds, worked, but not mounted or set (excluding industrial diamonds) | 19.4% | 8.9% | 17615.65 | 27.3% | 0.01 |
| '711319 | Articles of jewellery and parts thereof, of precious metal other than silver, whether or not plated or clad with precious metal (excluding articles > 100 years old) | 8.3% | 10.5% | 9022.35 | 10.4% | 291.6 |
| Total of top 4 commodities | 68.4% | 26814 | 291.61 | |||
| Rest of the commodities under HS code 71 | 31.6% | 31784 | 333.6 | |||
| HS 94 - Furnitures | ||||||
| '940190 | Parts of seats, n.e.s. | 13.6% | 12.9% | 65.84 | 0.2% | 7.6 |
| '940161 | Upholstered seats, with wooden frames (excluding convertible into beds) | 10.1% | 7.7% | 18.42 | 0.1% | 0.22 |
| '940360 | Wooden furniture (excluding for offices, kitchens and bedrooms, and seats) | 10.0% | 10.5% | 552.04 | 2.1% | 48.83 |
| '940320 | Metal furniture (excluding for offices, seats and medical, surgical, dental or veterinary furniture) | 8.7% | 7.2% | 145.36 | 0.8% | 23.3 |
| '940510 | Chandeliers and other electric ceiling or wall lighting fittings (excluding for lighting public open spaces or thoroughfares) | 6.5% | 6.7% | 52.9 | 0.3% | 20.15 |
| '940350 | Wooden furniture for bedrooms (excluding seats) | 6.3% | 4.8% | 13.6 | 0.1% | 0.19 |
| '940390 | Parts of furniture, n.e.s. (excluding of seats and medical, surgical, dental or veterinary furniture) | 5.2% | 5.8% | 28.01 | 0.2% | 6.15 |
| '940540 | Electric lamps and lighting fittings, n.e.s. | 5.4% | 7.2% | 37.60 | 0.2% | 4.16 |
| Total of top 8 commodities | 65.8% | 913.77 | 110.6 | |||
| Rest of the commodities under HS code 94 | 34.2% | 1831 | 313,4 | |||
| HS 39- Plastics and articles | ||||||
| '392690 | Articles of plastics and articles of other materials of heading 3901 to 3914, n.e.s (excluding goods of 9619) | 14.6% | 10.75% | 555.98 | 0.8% | 22.9 |
| '391810 | Floor coverings, whether or not self-adhesive, in rolls or in the form of tiles, and wall or ceiling coverings "in rolls with a width of >= 45 cm, consisting of a layer of plastics fixed permanently on a backing of any material other than paper, the face side of which is grained, embossed, coloured, design-printed or otherwise decorated", of polymers of vinyl chloride | 6.4% | 1.46% | 43.15 | 0.5% | 6.16 |
| '392410 | Tableware and kitchenware, of plastics | 5.9% | 1.72% | 144.22 | 1.2% | 1.16 |
| '392490 | Household articles and toilet articles, of plastics (excluding tableware, kitchenware, baths, shower-baths, washbasins, bidets, lavatory pans, seats and covers, flushing cisterns and similar sanitary ware) | 4.8% | 1.40% | 41.49 | 0.5% | 1.13 |
| '392321 | Sacks and bags, incl. cones, of polymers of ethylene | 4.2% | 1.79% | 156.71 | 1.3% | 0.4 |
| '392620 | Articles of apparel and clothing accessories produced by the stitching or sticking together of plastic sheeting, incl. gloves, mittens and mitts (excluding goods of 9619) | 3.7% | 1.17% | 7.33 | 0.1% | 0.05 |
| '392010 | Plates, sheets, film, foil and strip, of non-cellular polymers of ethylene, not reinforced, laminated, supported or similarly combined with other materials, without backing, unworked or merely surface-worked or merely cut into squares or rectangles (excluding self-adhesive products, and floor, wall and ceiling coverings of heading 3918) | 2.7% | 2.53% | 86.64 | 0.5% | 2.3 |
| '392390 | Articles for the conveyance or packaging of goods, of plastics (excluding boxes, cases, crates and similar articles; sacks and bags, incl. cones; carboys, bottles, flasks and similar articles; spools, spindles, bobbins and similar supports; stoppers, lids, caps and other closures) | 2.6% | 1.45% | 146.76 | 1.7% | 11.8 |
| '390140 | Ethylene-alpha-olefins copolymers, having a specific gravity of < 0,94 , in primary forms | 2.5% | 2.37% | 99.81 | 0.7% | 1.47 |
| '390120 | Polyethylene with a specific gravity of >= 0,94, in primary forms | 2.2% | 4.62% | 416.12 | 1.5% | 0.18 |
| Total of top 10 commodities | 49.5% | 1698.21 | 47.55 | |||
| Rest of the commodities under HS code 39 | 50.5% | 6974.87 | 241.1 | |||
| HS 29 – Organic Chemicals | ||||||
| '293499 | Nucleic acids and their salts, whether or not chemically defined; heterocyclic compounds (excluding with oxygen only or with nitrogen hetero-atom[s] only, compounds containing in the structure an unfused thiazole ring or a benzothiazole or phenothiazine ring-system, not further fused and aminorex "INN", brotizolam "INN", clotiazepam "INN", cloxazolam "INN", dextromoramide "INN", haloxazolam "INN", ketazolam "INN", mesocarb "INN", oxazolam "INN", pemoline "INN", phendimetrazine "INN", phenmetrazine "INN", sufentanil "INN", and salts thereof, and inorganic or organic compounds of mercury whether or not chemically defined, and products of 3002 10) | 12.1% | 4.8% | 527.39 | 2.8% | 5.82 |
| '293359 | Heterocyclic compounds with nitrogen hetero-atom[s] only, containing a pyrimidine ring, whether or not hydrogenated, or piperazine ring in the structure (excluding malonylurea "barbituric acid" and its derivatives, allobarbital "INN", amobarbital "INN", barbital "INN", butalbital "INN", butobarbital "INN", cyclobarbital "INN", methylphenobarbital "INN", pentobarbital "INN", phenobarbital "INN", secbutabarbital "INN", secobarbital "INN", vinylbital "INN", loprazolam "INN", mecloqualone "INN", methaqualone "INN" and zipeprol "INN", and salts thereof) | 8.7% | 5.4% | 384.55 | 1.8% | 5 |
| '293590 | Sulphonamides (excl. perfluorooctane sulphonamides) | 7.2% | 2.5% | 259.71 | 2.5% | 1.29 |
| '293719 | Polypeptide hormones, protein hormones and glycoprotein hormones, their derivatives and structural analogues, used primarily as hormones (excluding somatropin, its derivatives and structural analogues, and insulin and its salts) | 5.3% | 2.0% | 35.26 | 0.4% | 0 |
| '293379 | Lactams (excluding 6-hexanelactam "epsilon-caprolactam", clobazam "INN", methyprylon "INN", and inorganic or organic compounds of mercury) | 5.8% | 4.5% | 108.53 | 0.7% | 0.81 |
| '293299 | Heterocyclic compounds with oxygen hetero-atom[s] only (excluding compounds containing unfused furan ring, whether or not hydrogenated, in the structure, and lactones, isosafrole, 1-[1,3-benzodioxol-5-yl]propan-2-one, piperonal, safrole, tetrahydrocannabinols "all isomers", and inorganic or organic compounds of mercury) | 3.7% | 1.2% | 139.61 | 4.1% | 0.9 |
| '293339 | Heterocyclic compounds with nitrogen hetero-atom[s] only, containing an unfused pyridine ring, whether or not hydrogenated, in the structure (excluding pyridine, piperidine, alfentanil "INN", anileridine "INN", bezitramide "INN", bromazepam "INN", difenoxin "INN", diphenoxylate "INN", dipipanone "INN", fentanyl "INN", ketobemidone "INN", methylphenidate "INN", pentazocine "INN", pethidine "INN", pethidine "INN" intermediate A, phencyclidine "INN" "PCP", phenoperidine "INN", pipradol "INN", piritramide "INN", propiram "INN", trimeperidine "INN", and salts thereof, and inorganic or organic compounds of mercury) | 3.0% | 3.4% | 731.35 | 5.4% | 44.06 |
| '293410 | Heterocyclic compounds containing an unfused thiazole ring, whether or not hydrogenated, in the structure | 3.1% | 0.7% | 60.65 | 3.1% | 6.94 |
| '293399 | Heterocyclic compounds with nitrogen hetero-atom[s] only (excluding those containing an unfused pyrazole, imidazole, pyridine or triazine ring, whether or not hydrogenated, a quinoline or isoquinoline ring-system, not further fused, whether or not hydrogenated, a pyrimidine ring, whether or not hydrogenated, or piperazine ring in the structure, and lactams, alprazolam "INN", camazepam "INN", chlordiazepoxide "INN", clonazepam "INN", clorazepate, delorazepam "INN", diazepam "INN", estazolam "INN", ethyl loflazepate "INN", fludiazepam "INN", flunitrazepam "INN", flurazepam "INN", halazepam "INN", lorazepam "INN", lormetazepam "INN", mazindol "INN", medazepam "INN", midazolam "INN", nimetazepam "INN", nitrazepam "INN", nordazepam "INN", oxazepam "INN", pinazepam "INN", prazepam "INN", pyrovalerone "INN", temazepam "INN", tetrazepam "INN" and triazolam "INN", and salts thereof) | 3.4% | 4.2% | 906.39 | 5.7% | 5.14 |
| '292429 | Cyclic amides, incl. cyclic carbamates, and their derivatives; salts thereof (excluding ureines and their derivatives, salts thereof, 2-acetamidobenzoic acid "N-acetylanthranilic acid" and its salts and ethinamate "INN") | 1.4% | 1.4% | 310.37 | 5.5% | 0.02 |
| Total of top 10 commodities | 53.8% | 3463.81 | 69.98 | |||
| Rest of the commodities under HS code 29 | 46.2% | 17757 | 543.2 | |||
| HS 61 & 62 – Apparels | ||||||
| '621010 | Garments made up of felt or nonwovens, whether or not impregnated, coated, covered or laminated (excluding babies' garments and clothing accessories) | 27% | 4.8% | 44.54 | 0.5% | 3.6 |
| '611020 | Jerseys, pullovers, cardigans, waistcoats and similar articles, of cotton, knitted or crocheted (excluding wadded waistcoats) | 14% | 11.9% | 168.24 | 0.7% | 18.1 |
| '620342 | Men's or boys' trousers, bib and brace overalls, breeches and shorts, of cotton (excluding knitted or crocheted, underpants and swimwear) | 11% | 10.9% | 438.26 | 1.8% | 11.2 |
| '611030 | Jerseys, pullovers, cardigans, waistcoats and similar articles, of man-made fibres, knitted or crocheted (excluding wadded waistcoats) | 11% | 10.8% | 67.02 | 0.3% | 4.9 |
| '610910 | T-shirts, singlets and other vests of cotton, knitted or crocheted | 8% | 13.4% | 1698.93 | 5.6% | 49.5 |
| Total of top 4 commodities | 71% | 2,417 | 87.3 | |||
| Rest of the commodities under HS code 61 & 62 | 29% | 14,260 | 1,738 | |||
